

ASUS ENGTX260 TOP 896MB (NVIDIA GTX260)

Test Setup
A common mistake made when benchmarking graphics cards is that the rest of the PC system isn’t sufficient enough to test the GPU to its limits. This results in a bottleneck situation, where the system can only run at the speed of its slowest component. For this reason, the test configuration chosen below has been specially selected to give each of the graphics cards on test the headroom they require in order to produce the best results.
A selection of games and benchmark suites has also been chosen to test each of the cards with several game engines. Each of the cards will be run at both low and high resolutions with varying levels of texture filtering to represent the use of the card with both small and large screen sizes.
3DMark05
1024×768 / 0xAA / 0xAF (Default)
1920×1200 / 4xAA / 0xAF
1920×1200 / 4xAA / 0xAF
3DMark 06
1280×1024 / 0xAA / 0xAF
1920×1200 / 4xAA / 0xAF
1280×1024 / 0xAA / 0xAF
1920×1200 / 4xAA / 0xAF
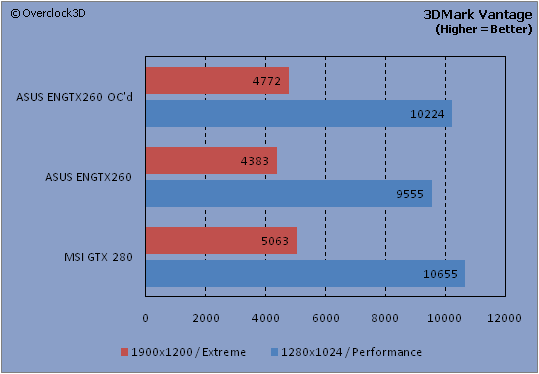
3DMark Vantage
1280×1024 / Performance Mode
1900×1200 / Extreme Mode
Quake4
1280×1024 / Ultra / 4xAA / 4xAF
1920×1200 / Ultra / 4xAA / 4xAF
1920×1200 / Ultra / 4xAA / 4xAF
Unreal Tournament III
1280×1024 / DX10 / High / 0xAA / 0xAF
1920×1200 / DX10 / High / 0xAA / 0xAF
1920×1200 / DX10 / High / 0xAA / 0xAF
Call of Duty 4
1280×1024 / Max / 4xAA / 4xAF
1920×1200 / Max / 4xAA / 4xAF
1920×1200 / Max / 4xAA / 4xAF
F.E.A.R
1280×1024 / Max / 4xAA / 4xAF
1920×1200 / Max / 4xAA / 0xAF
1280×1024 / Max / 4xAA / 4xAF
1920×1200 / Max / 4xAA / 0xAF
BIOSHOCK
1280×1024 / DX10 / High / 0xAA / 0xAF
1920×1200 / DX10 / High / 0xAA / 0xAF
1280×1024 / DX10 / High / 0xAA / 0xAF
1920×1200 / DX10 / High / 0xAA / 0xAF
Crysis
1280×1024 / DX10 / High / 0xAA / 0xAF
1920×1200 / DX10 / High / 0xAA / 0xAF
1920×1200 / DX10 / High / 0xAA / 0xAF
At present, the GTX260 only really has competition from the red side of the fence in the form of AMD’s HD4870. However, as samples have been extremely tight since its release, the nearest cards we have for comparison is the AMD 4850. Obviously, this isn’t the fairest of competitions, as there is a significant price difference between both cards, but it will certainly be interesting to see if the GTX260 is worth the extra cash over the 4850 when placed on our CPF (Cost Per Frame) scale.
Another area of interest as mentioned over the previous pages is just how well the factory overclocked ASUS ENGTX260 TOP performs in comparison to a GTX280. With a higher clock and memory speed, can it match the performance of the GTX280 at a more reasonable price?
During the benchmarking phase, we will be using the following prices extracted from aria.co.uk on 09/07/08 to produce our CPF graphs. Please remember that these graphs are static and only represent a snapshot of the market at the time of this review.
MSI 9800GTX – £184.99
ASUS 9800GX2 – £317.19
MSI GTX280 – £422.94
ASUS 4850 – £123.90
ASUS GTX260 – £223.19
Overclocking
Using the NVIDIA nTune utility along with its inbuilt stability tester to test for artifacts, the maximum overclock we managed to achieve on the ENGTX260 was 701mhz /1265mhz /1510mhz for the GPU, Memory and Shaders respectively.
This gave a reasonable 7% increase in our 3DMark Vantage score (9555 to 10224) at “Performance” settings and a fairly similar increase of just over 8% at “Extreme” settings. Maybe not enough to top the GTX280…but still quite close.
Now let’s get on to the benchmarks…